Objects located on the ground are transferred to the map in the form of special conventional signs.
Topographic signs are conditional symbols that designate various objects on the territory in the form of images in topographic plans and maps. There are a huge number of them, and each is usually attributed to a specific group.
Topographic signs and their designations
All conventional symbols can be divided into three categories:
1. Explanatory.
These are all characters that were not assigned to any other group. They express additional characteristics of objects on the ground. That is, they cannot exist by themselves, but only provide more detailed information about objects of out-of-scale and contour types.
For example: a forest is depicted on the map, and a deciduous tree is added inside the contour, which will indicate the type of plants and their age.
Also, this type of topographic signs includes other designations:
- numbers (used to indicate the exact number of something - low-water level of water areas, the highest points of relief, etc.);
- signatures (used fordesignations of the proper names of objects - settlements, rivers, etc., specification of the type of enterprise - a concrete or brick plant, explanations of the type of buildings that do not have their own designations, but stand out by function - a hospital, a railway booth, etc.; quantitative characteristics of the object - depth, height, etc.).
2. Outline (scale).
These are topographic signs that can be expressed on the scale of a plan or map.
Such symbols are used to mark forests, swamps and vegetable gardens, lakes, i.e. for such objects that are expressed on the scale of a topographic map. The contours of these topographical signs usually reflect the boundaries of real objects and are expressed in some color (green, blue, white).
Inside the contour is filled with a certain symbol.
3. Off-scale.
Such symbols include pictures of small objects that are difficult to identify in real scale (for example, a church, a tower, etc.). Their number and parameters directly depend on the size of the plan or map. That is, in plans with a small scale, they will be smaller and in much smaller quantities.
It is also worth noting that elements such as poles, trees and wells are drawn on plans of any size. And some signs change appearance based on the scale of the map.
Out-of-scale conditional topographical signs compare favorably with contours in that they always show exactly where the objects they indicate are located.
Do not forget that symbols of this type cannot show the real parameters of the object, soit is not necessary to measure the magnitude of such signs on the map. These signs include:
- weather station;
- spring;
- fuel mine.
4. Linear.
These are the characters that are displayed in real size only in length (and not in width). Topographic signs and their designations in pictures can show railways, oil pipelines, highways, etc. They are marked with lines showing the real length of the object (within a given scale). Such conventional signs are very convenient for orientation.
There are also mixed symbols for topographic plans and maps. In particular, symbols with a signature. Some objects are marked this way, including rivers marked with the speed of the current.
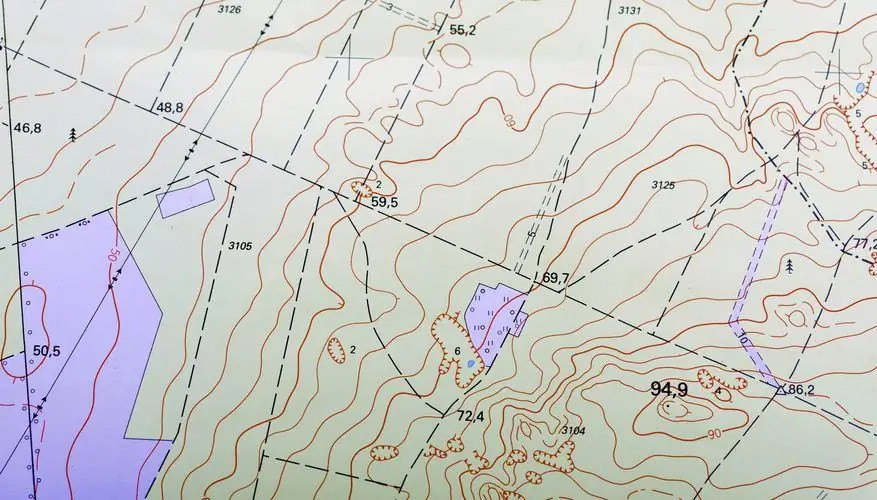
Basic topographic symbols
Topographic map symbols:
1. Relief:
- horizontal;
- bergstrokes (slope direction indicators);
- contour labels.
2. Cities and villages, industrial centers, roads and communication lines:
- power stations;
- careers;
- cavods and factories with pipes;
- forest and field roads;
- villages, villages, cities.
3. Hydrography:
- well;
- rivers and streams;
- lake;
- metal and wooden bridges;
- piers;
- dams;
- bogs.
4. Vegetation:
- meadows;
- arable land;
- cutting;
- shrubs;
- orchards.
5. An isoline is a line that connects points with equivalent data of the lines shown:
- isobars (equal atmospheric pressure);
- isotherms (equal air temperature);
- isohypses (also called horizontals) - equal heights of the earth's surface.
Such topographic signs are used at any ratio, including 1:1 500, 5 000.
Scale
Scale is the ratio of the length of an object on a map or plan to its actual length. This means that this is data on how many times the unit is less than the real interval. For example, you need to measure 1 cm on a topographic plan with conventional signs and at a scale of 1:1,500. This suggests that the interval that is 1 cm on the map will be 1,500 cm (15 m) in the real area.
Scale happens:
Graphic
A) linear.
It happens that the ratio is not equal to 1 cm. Then a linear scale is used. This is an auxiliary tool, a ruler, which is applied to simplify distance measurements. Most often this scale is used on topographic plans. Then you definitely need to use a caliper. To do this, the two ends of the tool must be placed on the division of the linear scale and moved according to the plan.
B) transverse.
Nomogram (an image of functions of several variables, which allows you to explore dependence functions without calculations, only thanks to simple geometric operations), which is created by observing the proportionality of the segmentsparallel lines. They cross the sides of the corner.
To do this, on the line at the bottom of this type of scale, the length is measured, while the right side should be at the whole division of OM, and the left side should go beyond 0.
2. Named.
Speech information about what interval in reality is 1 cm on a plan or map. This type of scale is indicated by named numbers and the corresponding length of two segments on the map in natural form (for example, 1 cm - 3 km).
The verbal form is convenient, since the length of lines on the ground is usually found in meters, and on maps and plans - in centimeters. 1 cm is equal to 30 meters, which means that the numerical scale will be 1:3000.
1 m is equal to 100 cm, that is, the number of meters of terrain contained in 1 cm of a plan or map will be easily found by dividing the denominator of the numerical scale by 100.
3. Numerical.
Scales of this type are used most often. They are also called two-kilometer, five-kilometer, etc. They are depicted as a fraction. The numerator in it is one, and the denominator is a number that indicates the number of times the image is reduced (1:M).
If you want to compare different numerical scales, then the smallest one will be the one with the larger denominator M. The largest will be the ratio with the smallest denominator М.
For example: scale 1:10,000 is larger than scale 1:100,000. Scale 1:50,000 is smaller than scale 1:10,000. There are standard numerical scales in Russia: from 1:10,000 to 1: 1,000,000.
The same scale can be written in any of the above ways, the essence is whenthis one will stay the same. Using the ratio, you can measure the interval between any objects (volcanoes, settlements, lakes, rivers, etc.). You just need to take a ruler and measure the distance. The resulting number of centimeters must be multiplied by the denominator of the fraction.
What scales are most common?
And now it's worth considering the scales most common for use in Russia.
- 1:5000. In an inscription on a plan or map with topographic symbols 5000, all numbers are expressed in cm. Such an inscription means that 1 cm on the map contains 5000 cm on the ground. For convenience, it is worth converting centimeters to meters. It turns out that 1 cm is equal to 50 meters (or 5 km).
- 1:500. Topographic signs with a scale of 1:500 were drawn up specifically for Moscow and its forest park zone. The use of this scale was required due to the density of buildings in the city and the large number of underground utilities.
- 1:2000.
- 1:1500. Commonly used scale. Easy to compose and read.
And now the most common conditional topographical signs (1,500, etc.) should be noted.
Geodetic points:
- points of planned point networks of long-term and short-term fixing on the ground, as well as in the walls and at the corners of capital buildings;
- demarcation marks and poles for fastening the layout project;
- places of the geodetic network of the state (mounds, buildings, natural mounds, remnant rocks);
- astronomical and landmark points;
- place of anchor pointconstruction nets;
- leveling marks: fundamental and ground benchmarks, rock and wall marks.
2. Buildings and their parts, structures:
- fire-resistant residential and non-residential premises made of brick, stone and cinder block;
- non-fire-resistant residential and non-residential buildings (wooden and adobe);
- residential and non-residential buildings of mixed type with a fire-resistant lower floor made of wood with thin brick cladding;
- under construction and demolished structures;
- religious buildings.
3. Agricultural, industrial and municipal industries:
- with and without pipes;
- mouths of active and inactive adits, trunks, pits;
- rocks and dumps;
- reinforced and unreinforced slopes, typical for conventional signs of topographic plans 1 500 scale;
- wells, wells, oil outlets, gas stations and tanks;
- technological, offshore and loading racks;
- cranes, towers, spotlights and transformers.
4. Railways and nearby facilities:
- monorail, electrified, narrow gauge railways;
- tram lines under construction and operating;
- entrances to galleries and tunnels;
- decals and turntables;
- station tracks;
- crossings, barriers, gates and viaducts;
- cargo platforms and loading bays;
- semaphores and traffic lights;
- warning discs, signs and shields;
- motorways and carriagewaysroads;
- pack and hiking trails, cattle passes.
Other scales
In the main practice of land management, maps and plans are usually created on a scale from 1:10,000 to 1:50,000. Conventional signs of topographic plans of such scales are most often the same in the image, but differ only in their size.
Accuracy
This is the name of a segment of a horizontally laid line.
The marginal probability with which you can measure and build segments is limited to a figure of 0.01 cm. The number of meters of terrain corresponding to it on the scale of a plan or map depicts the ultimate graphical accuracy of a particular ratio. This accuracy indicates the length of the laid horizontal line of the terrain (in meters). So, to determine this accuracy, you need to divide the denominator of the numerical scale by 10,000.
For example: 1:25,000 scale is 2.5 m; 1:100,000 equals 10 m.
Mapping
Used to show some geographical objects on the map. There are several basic options:
- Method of areas ("space", "area"). Areas where natural or social phenomena are common (fauna and plants).
- Signs of movement. This method of mapping is used to show the direction of movement of the sea, winds, traffic flows.
- Quality background. Determines the separation of plots according to some criteria: economic,political or natural. Explains the qualitative characteristics of continuous phenomena on the earth's surface (soil) or objects that have a massive dispersed space (population).
- Quantitative background.
Indicates parcel subdivisions by some quantity.
Equal Spacing Principle
Helps to determine the average value of the phenomenon. There are several ways to get the intervals you want.
- Cartogram. To get the interval, you need to divide the difference between the largest and smallest number by 5. For example: 100 - 25 \u003d 75. The resulting number 75 must be divided by 5, it turns out 15. Therefore, the resulting intervals will vary from 25 to 100 every 15 units: 25 - 40 etc.
- Map chart. This method is used in cases where it is necessary to show the overall magnitude of the phenomenon in a certain area (number of students, fresh water supply, etc.).
- Scheme. This method is a simplified view of the map, which does not have a degree network.
Topographic maps
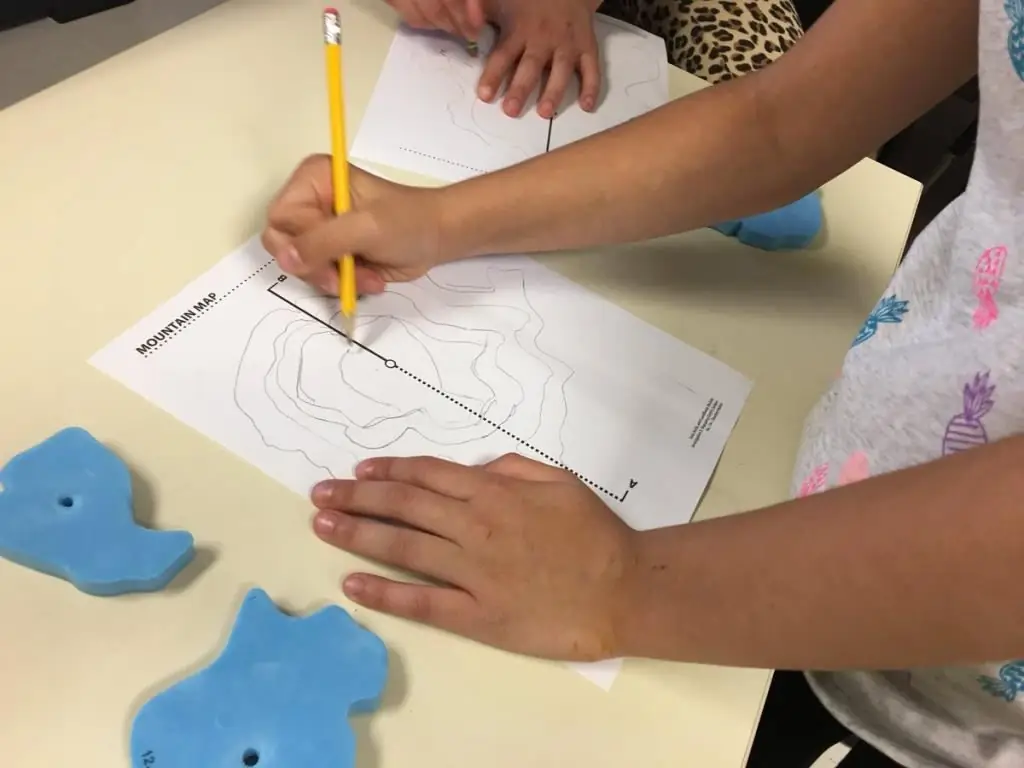
This is an image that was created in a reduced form, taking into account certain mathematical laws. It can be built on the plane of the entire planet or individual components in accordance with the curvature of the Earth.
According to the meridians, a topographic map with symbols for topographic plans 1 500 is oriented so that the north is always on top. This makes it very easy to navigate the terrain when usingcompass or other device.
Any topographic map has many characteristics. The main ones are scale and informativeness. Most often, the rule is observed that the larger the scale, the higher the information content.
Informativeness - the quantity and quality of information that the map contains.
The quality of the card is expressed by:
- up to date (the more up-to-date the map, the more accurate its data);
- accuracy of lines, scaffolding contours, etc.
The amount of information is also very important. More detailed information makes it easier to work with the map (for example, the presence of wells, fences, etc.).
Informativeness of topographic maps is provided by conventional signs.
By scale, maps are divided into:
- Large scale (ratio 1:100,000 and larger).
- Mid-scale (from 1:200,000 to 1:1,000,000).
- Small scale (ratio less than 1:1,000,000).
When creating any topographic maps with conventional signs, it is better to build additionally:
- cartographic grid (meridians and parallels);
- kilometer grid (lines that are parallel to the central meridian and the equator).
Besides, you need to remember that the scale of the map at each individual point will have its own individual value. It will depend on the longitude and latitude of a particular point.

Plan
This is a projection, a reduced image of something on a horizontal plane.
There are plans:
- Topographic. This is a drawing of the area, which only shows the situation.
- Contour (situational). On such topographic plans with conventional signs, in addition to the situation, the relief is also depicted. Unlike a map, the scale of a plan is the same at all its points.
Errors
Disadvantages associated with measuring distance on maps can be related to:
- With measurement inaccuracy.
- With errors that were made when compiling the map itself.
- With bruises, bends, breaks and other defects on the topographic plan or map.
Amendments
Even if all of the above conditions are met, there is a great risk that the measurements will not be accurate. This can happen for several reasons:
- Tilt. Also, when determining the distance of any objects, it is necessary to take into account the slope, since the map is only a projection of the real area on the plane. Accordingly, it does not take into account these slopes and may give an incorrect result. Moving on sloping terrain, a person additionally covers a distance up and down. That is, the actual distance on the plane will always be greater than the gap that was measured on the map. For example, if the terrain is tilted at 42 degrees, the correction factor will be 1.35. This means that the distance set on the map or plan must be multiplied by 1.35.
- Road straightening. On small-scale topographic maps with conventional signs, as well as graphs of mountainous areas, there is often nothe ability to draw in detail all the bends of the roads. Therefore, they are usually straightened, due to which the previously calculated distance on the map will be less than the actual one, up to a difference of 1.3 times.


