The article describes the compilation of statistical tables, their types, requirements for their components. An algorithm for the rational construction of statistical tables convenient for perception and analysis is presented. Examples of such tables are given. One of the most common methods for presenting systematic numerical information is a table. It is used in almost any area of life, both in the scientific environment (humanitarian and technical), and in the daily display of data from any field of activity.
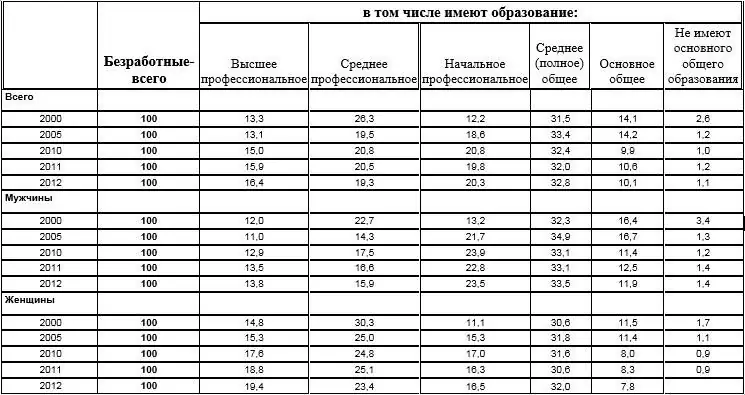
In order to be able to systematically and integrally present disparate numerical information, it must first be properly processed, cleared of secondary factors of influence. Then it must be visualized for ease of further analysis. That's what tables are for. There is a science - statistics, which gives the concept of statistical tables, methods and features of constructing various varieties of these tables.
The essence of the statistical table
It should be understood that any incoherent and economically meaningless numerical data, evenaggregated and posted are not considered statistical tables. Most often, in the form of tables of a statistical nature, the numerical attributes of phenomena are displayed, which are the result of grouping and summing up various numerical series. A statistical table is recognized as a table that allows you to quantify visually a certain statistical area of data obtained as a result of specialized information and grouping.
Benefits of displaying data in tabular form
The main advantage of presenting information in a tabular form is the possibility of carrying out comparative calculations and analytical work on information reflected in a structured form of numbers. This information itself, as a rule, is already the subject of primary processing, grouping and information on some basis. In such cases, statistical tasks require the use of the table method.
The tabular method has the following advantages:
- improves external perception of data;
- facilitates the procedure and reduces the time of analysis, study of the phenomena indicated in the table;
- allows you to visually see the dynamics of the periodicity of the phenomenon (when compared);
- makes it possible to observe the relationship of information with several criteria;
- facilitates the creation of graphical models based on tabular information.
The most important elements that make up the statistical table
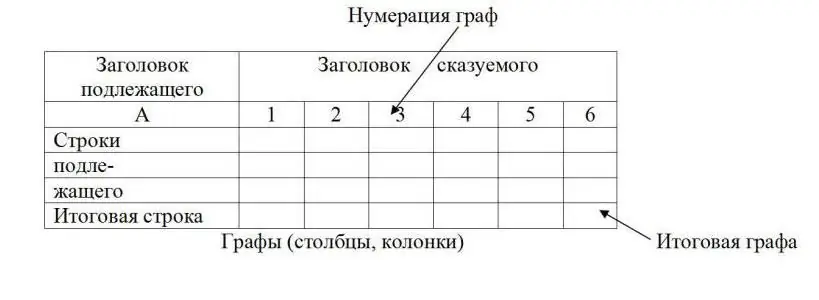
The subject and predicate of the table are considered the most importantcomponents of any kind of table. Most often, the table is placed vertically in the document, although there are horizontal options. These options are useful if the table has a large number of columns. With this type of data, vertical orientation will make it much more difficult to understand the information and analyze it.
Basic requirements for the subject of the statistical table
Part of the table in the form of the studied object, consisting of numerical values, is considered to be the subject of the table. In the form of it, several groups of numerical data, collected together according to some criteria, can also act. Most often, the subject is an enumeration of some elements of the phenomenon, which is studied in the form of a table. It acts as line names. It is necessary to ensure identical units of measurement of the same dimension in all cells of the table.
The elements that make up the statistical table must be verified, objective and consistent. The use of unique, not generally recognized abbreviations (thousands, millions, etc.) is unacceptable. If there are significantly more elements presented in the subject of the table than in the predicate, it is better to replace the predicate and the subject mutually.
Basic requirements for the predicate of the statistical table
The group of identifiers describing the object under study (subject) is the predicate of the table. The predicate illustrates the elements, groups of the studied population. The role of the predicate is played by the headings, the contents of the columns with a reasonable spatial distribution of values from left to right. Similarlysubject, it necessarily contains meters of the same dimension for the entire population.
The use of non-standard abbreviations in the predicate is also inappropriate. Frequent use of commas and periods in the predicate is not recommended. Such signs make it very difficult to understand the data and can lead to confusion and errors. It is imperative to remember that in Russian practice, tenths of an integer are separated by a dot or a comma. In foreign practice, a dot is also often separated by a dot every three zeros in a large integer. If there are several columns with the same names in the table, it is advisable to combine them.
Algorithm for creating a statistical table
The most rational way to compile any kind of statistical table can be achieved using six simple rules. You should always follow these rules, it will allow you to create statistical tables correctly, without errors, and the constructed tables will be quickly read and easily perceived.
Construction of any statistical table begins with the assignment of some number to it. The serial number allows you to make each of them unique. Having assigned a number to the table, it must also be given a general title that briefly describes the content, topic, and area of study. The header may also mention the date the data was compiled or received, as well as the period displayed. Headings can be side, top and general.
At the third stage, you need to choose a table layout that is suitable for this set of word-numeric data. This isa rectangular field divided by the intersection of rows of vertically and horizontally directed lines forming rows and columns consisting of cells. It is in these fields that all information will be recorded. The columns of the table and its rows must be consecutively numbered for greater clarity, avoidance of confusion and ease of transferring the table from one page of the document to another. Instead of a number, you can assign a unique letter code.
At the fourth stage of building statistical tables, you need to enter all the necessary data sequentially into the cells. At the penultimate, fifth stage of compiling the table, it is necessary to fill in the fields with information. It is advisable to do this by moving from column to column, introducing the necessary statistical indicators into it. Such an indicator is nothing more than a numerical description expressing some parameter, characteristic, property of the phenomenon described in the table.
At the last stage of filling in any statistical table, notes are written for it, if they are necessary. The source of the data, the method of statistical processing, the sample size, the place of data collection, or the algorithm for working with the table are indicated.
Other construction features
Numeric and textual information are integral elements that make up the statistical table. The calculated values are entered after all statistical data have been entered. It is necessary to observe a single dimension of the data entered into the cells in any type of statistical tables. It is advisable to enter numerical data so that the digits of these numbers in the cells of one columnlocated exactly under each other (a thousand - under a thousand, a million - under a million).
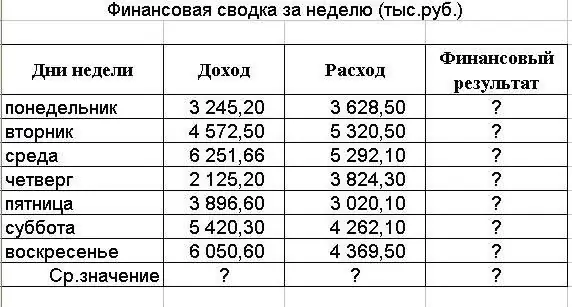
All numbers in the table must have the same number of decimal places. If the table contains only whole numbers, then it is not practical to enter decimal places. If the table has row-wise enumeration of numeric data, it must contain a column with the resulting sums for each row ("total" or "total"). Such a column can be either the first or last in the table. Rows for which data are missing or equal to zero are filled with special characters: "X" (not filled), "-" (absence) or the inscription "N/A" (no data).
Varieties of tables
Analysis of statistical tables reveals many of these objects of various types, methods of construction, purpose and direction. They differ in the features of the numerical sets used, structures, the relationship of factors that determine the elements of each table.
The structure of the subject and predicate of the table and the peculiarities of data grouping make it possible to divide the tables into four types:
- Combinational - the subject consists of several signs.
- Mixed - carry the features of both a group and a simple table.
- group - contain data grouped by some attribute.
- simple - represent the subject formed by a simple enumeration of units of the studiedaggregate, without division into groups.
Simple tables are:
Chronological (series of dynamics) - illustrate the change in the data of the subject over time

Listed (distribution rows) - contain in the subject listing all objects of the studied ordered set
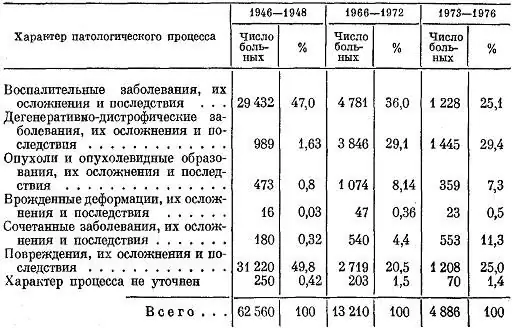
- Monographic - reveal a piece of data sorted by some attribute (a group or part of a population).
- Territorial - refers collectively to a list of geographical features.
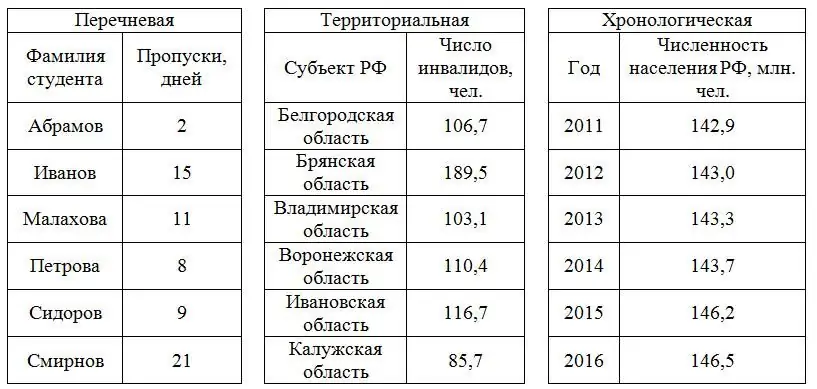
Statistical tasks may involve the appearance of other types of statistical tables.
Classification of tables by the nature of the subject
From the point of view of this criterion, there are simple tables and complex ones. The first of the mentioned types in the subject contains a list of some of the studied units of the population, together with a numerical characteristic of each object of study. The main purpose of such tables is the primary summary of some set of data. For a correct and complete understanding of the data in such a table, the observer does not need special statistical knowledge and skills.
Complex statistical tables are: mixed (there are signs related to both group and combination), group (the objects of the studied population are divided into groups according to a pre-selected sign) and combination (several signs inherent in the subjecttable).
Classification of tables by the nature of the predicate
The frequency of repetition of the values of a certain indicator and the degree of development of the predicate in the table allows us to distinguish the following types of statistical tables:
- Static - the indicator is defined in space and time, does not repeat either in time or geographically.
- Dynamic - data is recorded for several moments, periods within the boundaries of the phenomenon under study.
- Spatial - information is repeated for different areas.
- Spatio-temporal - provides a comprehensive coverage of the phenomenon in both time and space.
The complexity of constructing a statistical table determines the existence of a complex, simple and complex-combined predicate. The presence of repeatability of individual data of the indicator is an attribute of a complex predicate. Simple means that the indicator is present in the table as a quantitative attribute of the phenomenon under study, without taking into account its types. The presence of a combined grouping of data in the subject means that we have a table in which the model of a complex-combined predicate is applied.
Special view - balance sheets
Besides those mentioned above, there are balance statistical tables. Their peculiarity is that the predicate here is represented by balanced data that determines the two sides of the process under study.

A typical example of a balance sheet type statistical table is a balance sheet divided into assets and liabilities,the balance of which must be achieved when filling.
Conclusion
Statistical tables are very important for the analysis of any set of statistical data. The main elements that make up the statistical table are the subject and the predicate. They should always be filled out correctly, and only verified, relevant information should be used.
Compilation and analysis of such tables usually does not require special statistical knowledge. They are easily applied in all spheres of the national economy, are easy to understand and help to visualize and effectively present a large set of numerical data. Their use greatly facilitates the analysis, construction of trends and models for the development of the studied phenomena.


