When peer review, for example, assessing the competitiveness of products, it is necessary, as in any scientific work, to carry out statistical data processing. The latter begins with determining the consistency of expert opinions, the numerical expression of which is the concordance coefficient.
Why do we need an expert consensus assessment?
This assessment is necessary, first of all, because the opinions of experts can differ greatly on the estimated parameters. Initially, the assessment is carried out by ranking the indicators and assigning them a certain coefficient of significance (weight). An inconsistent ranking results in these coefficients being statistically unreliable. The opinions of experts with their required number (more than 7-10) should be distributed according to the normal law.
The concept of the coefficient of concordance
So. Consistency is concordance. The coefficient is a dimensionless quantity showing the ratio of the dispersion to the maximum dispersion in the general case. Let's generalize these concepts.
Concordance coefficient is a number from 0 to 1, showing the consistency of expert opinions whenranking some properties. The closer this value is to 0, the lower the consistency is considered. If the value of this coefficient is less than 0.3, the opinions of experts are considered inconsistent. When the value of the coefficient is in the range from 0.3 to 0.7, the consistency is considered average. A value greater than 0.7 is considered high consistency.
Use cases
When conducting statistical research, situations may arise in which an object may be characterized not by two sequences, which are statistically processed using the concordance coefficient, but by several sequences, which are accordingly ranked by experts with the same level of professionalism in a certain area.
The consistency of the ranking carried out by experts must be determined to confirm the correctness of the hypothesis that experts make relatively accurate measurements, which allows the formation of various groupings in expert groups, which are largely determined by human factors, primarily such as differences in views, concepts, different scientific schools, the nature of professional activity, etc.
Brief description of the rank method. Its advantages and disadvantages
When ranking, the rank method is used. Its essence lies in the fact that each property of the object is assigned its own specific rank. Moreover, each expert included in the expert group, this rank is assignedindependently, resulting in the need to process these data in order to identify the consistency of expert opinions. This process is carried out by calculating the coefficient of concordance.
The main advantage of the rank method is its ease of implementation.
The main disadvantages of the method are:
- a small number of ranking objects, since when their number exceeds 15-20, it becomes difficult to assign objective ranking scores;
- Based on the use of this method, the question of how far the studied objects are from each other in significance remains open.
When using this method, it must be taken into account that the ratings are based on some kind of probabilistic model, so they must be applied with caution, given the scope.
Kendall's Concordance Rank Coefficient
Used to determine the relationship between quantitative and qualitative features characterizing homogeneous objects and ranked according to the same principle.
This coefficient is determined by the formula:
t=2S/(n(n-1)), where
S - the sum of the differences between the number of sequences and the number of inversions on the second feature;
n - number of observations.

Calculation algorithm:
- The x values are ranked in ascending or descending order.
- The y-values are arranged in the order in which they correspond to the x-values.
- For each successive rank of y, determine how many higher rank values follow it. They are added together and the measure of correspondence of sequences of ranks in x and y is calculated.
- Similarly, the number of ranks of y with lower values is calculated, which also add up.
- Add the number of ranks with higher values and the number of ranks with lower values, resulting in the value S.
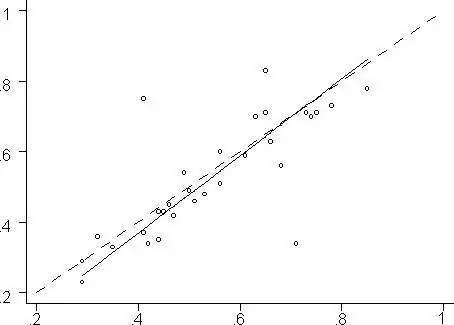
This coefficient shows the relationship between two variables, and in most cases is called the Kendall rank correlation coefficient. Such dependence can be represented graphically.
Determination of coefficient
How is it done? If the number of ranked features or factors exceeds 2, the concordance coefficient is used, which, in essence, is a multiple variant of rank correlation.
Be careful. The calculation of the concordance coefficient is based on the ratio of the deviation of the sum of squares of ranks from the average sum of squares of ranks, multiplied by 12, to the square of experts, multiplied by the difference between the cube of the number of objects and the number of objects.
Calculation algorithm
In order to understand where the number 12 comes from in the numerator of the calculation formula, let's look at the determination algorithm.
For each row with the ranks of a certain expert, the sum of the ranks is calculated, which is a random value.
The concordance coefficient is generally defined as the ratio of the variance estimate (D) to the maximum value of the variance estimate(Dmax). Let us successively formulate the definitions of these quantities.
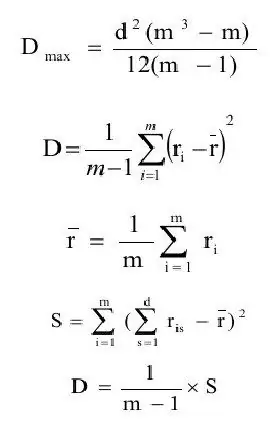
where ravg - expectation estimate;
m - number of objects.
Substituting the resulting formulas in relation to D to Dmax we get the final formula for the concordance coefficient:
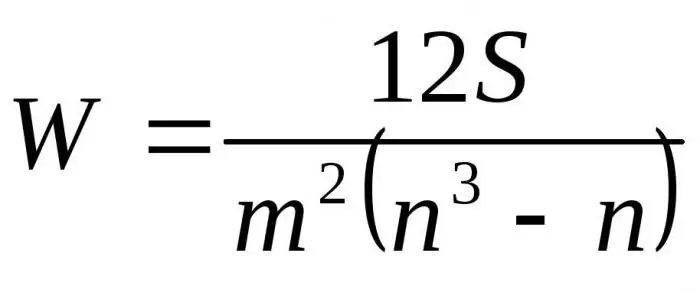
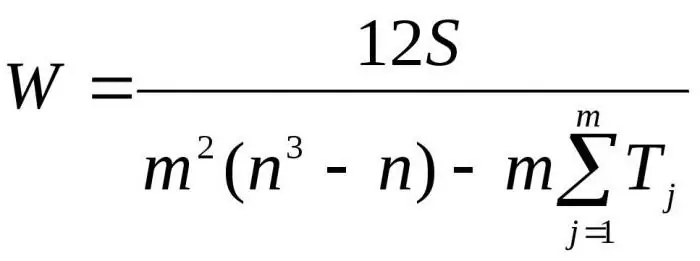
Here m is the number of experts, n is the number of objects.
The first formula is used to determine the concordance factor if there are no related ranks. The second formula is used if there are related ranks.
So, the calculation of the concordance coefficient is over. What's next? The obtained value is evaluated for significance using the Pearson coefficient by multiplying this coefficient by the number of experts and by the number of degrees of freedom (m-1). The resulting criterion is compared with the table value, and if the value of the first exceeds the last, they speak of the significance of the coefficient under study.
In the case of related ranks, the calculation of the Pearson criterion becomes somewhat more complicated and is performed by the following ratio: (12S)/(d(m2+m)-(1/(m-1))x(Ts1 +Ts2 +Tsn)
Example
Assume that the expert method evaluates the competitiveness of butter sold in a retail network. Let us give an example of calculating the concordance coefficient. Before assessing competitiveness, it is necessary to rank consumerproperties of this product that are involved in the evaluation. Let's assume that these properties will be the following: taste and smell, consistency and appearance, color, packaging and labeling, fat content, trade name, manufacturer, price.
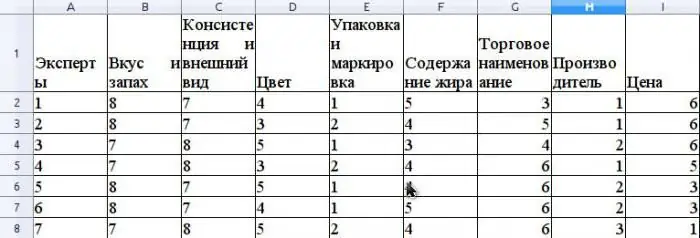
Assume that the expert group consists of 7 experts. The figure shows the results of ranking these properties.
The average value of r is calculated as the arithmetic average and will be 31.5. To find S, sum the squared differences between ris and r average, according to the formula above, and determine that the value of S is 1718.
Calculate the concordance coefficient using the formula without using related ranks (ranks would be related if the same Expert Advisor had the same ranks for different properties).
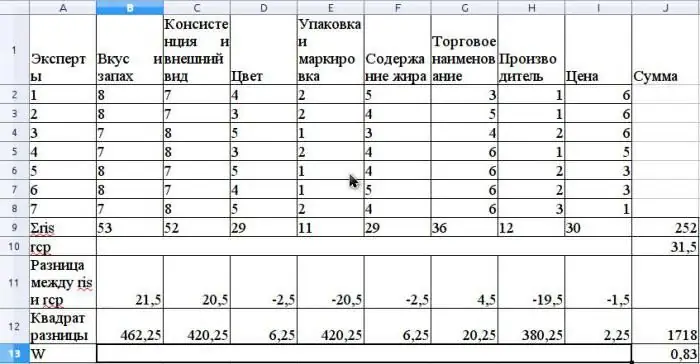
The value of this coefficient will be 0.83. This indicates a strong consensus among experts.
Check its significance using the Pearson test:
7 x 0.83 x (8-1)=40.7.
Pearson's tabular test at 1% significance level is 18.5, and at 5% - 14.1..
The example demonstrates the simplicity and accessibility of the calculation for any person who knows the basics of mathematical calculations. To alleviate them,use spreadsheet forms.
In closing
Thus, the coefficient of concordance shows the consistency of the opinions of several experts. The farther it is from 0 and closer to 1, the more consistent opinions. These coefficients must be confirmed by calculating the Pearson criterion.


